

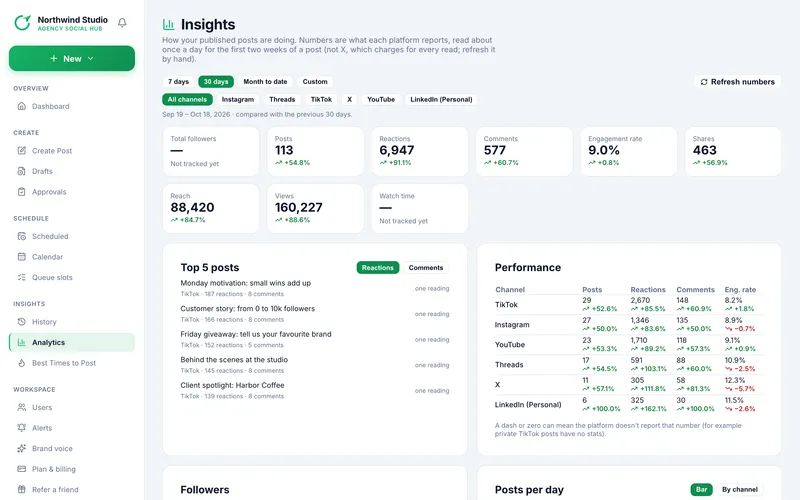
Open Analytics. It shows posts that went live in the last 120 days, with the numbers the platforms reported. See Post numbers for when they update.
1. Controls
- Date range: 7 days, 30 days, Month to date or Custom (choose a From and To date). A line under the controls states the range and that it is compared with the previous N days.
- Channel: All channels or one platform, shown when you have posted to more than one platform.
- Refresh numbers reads fresh numbers for your latest posts (see Post numbers).
2. What is on the page
| Section | Shows |
|---|---|
| Summary cards | Posts, Reactions, Comments, Engagement rate, Shares, Reach and Views for the range, each with an up or down percentage against the previous period of the same length. Nothing to compare yet means the earlier period had none. Total followers and Watch time read Not tracked yet. |
| Top 5 posts | Your best posts in the range, sorted by Reactions or Comments, with a small trend line of how the post's views grew between readings. |
| Performance | A table per channel: posts, reactions, comments and engagement rate, each with its change from the previous period. |
| Followers | Not collected yet, so there is nothing to chart. |
| Posts per day / week | A bar chart (switch Bar or By channel). Ranges up to 31 days show days; longer ranges show weeks. Show data table lists the values. |
| Your best times | Your best weekday and hour per platform, once there is enough data (see Best times in the composer). |
A dash or zero can mean the platform does not report that number, for example reach on some posts or any number for private TikTok posts.
Read next
- What each number means Definitions of reactions, engagement rate, reach, views and the comparison arrows.
- Post numbers: when they update and how to refresh them Where views, likes, comments and shares come from, the automatic daily reading, and the manual refresh.
- Best Times to Post: the heatmap When each platform's audience is most active, by hour and weekday, with four goals to choose from.
More in Analytics and timing